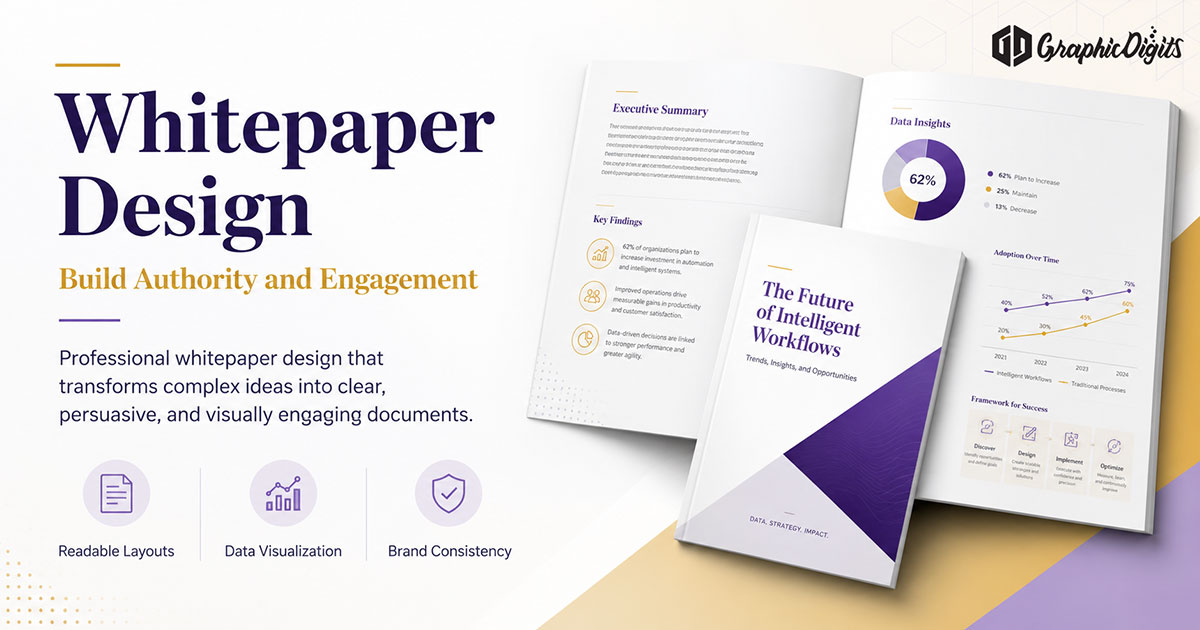
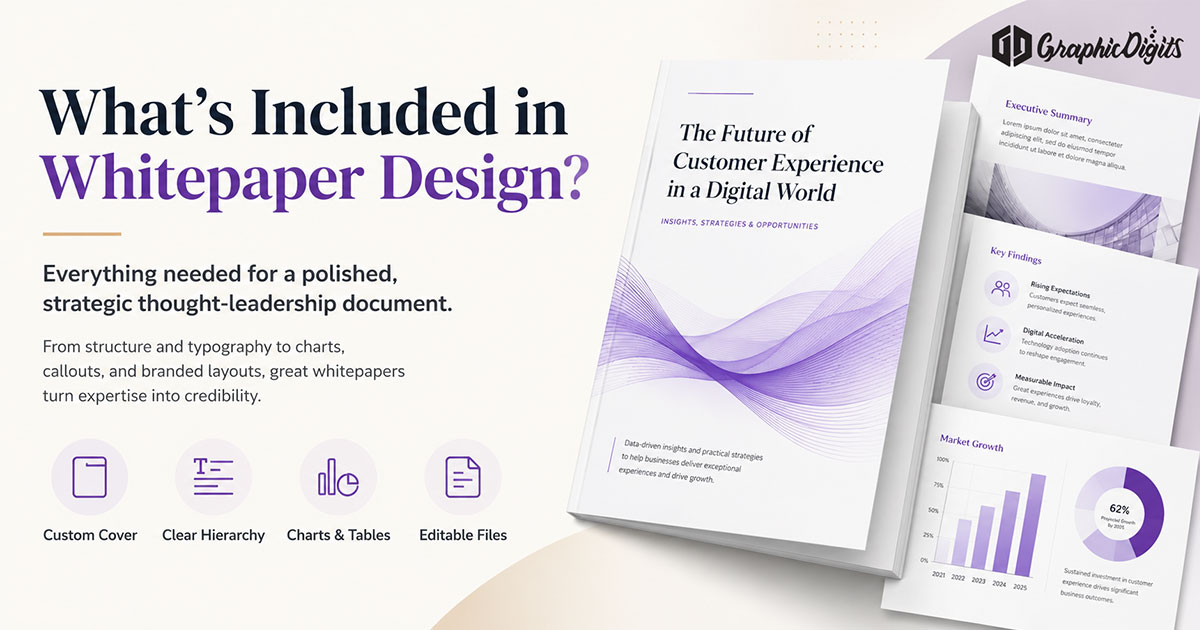
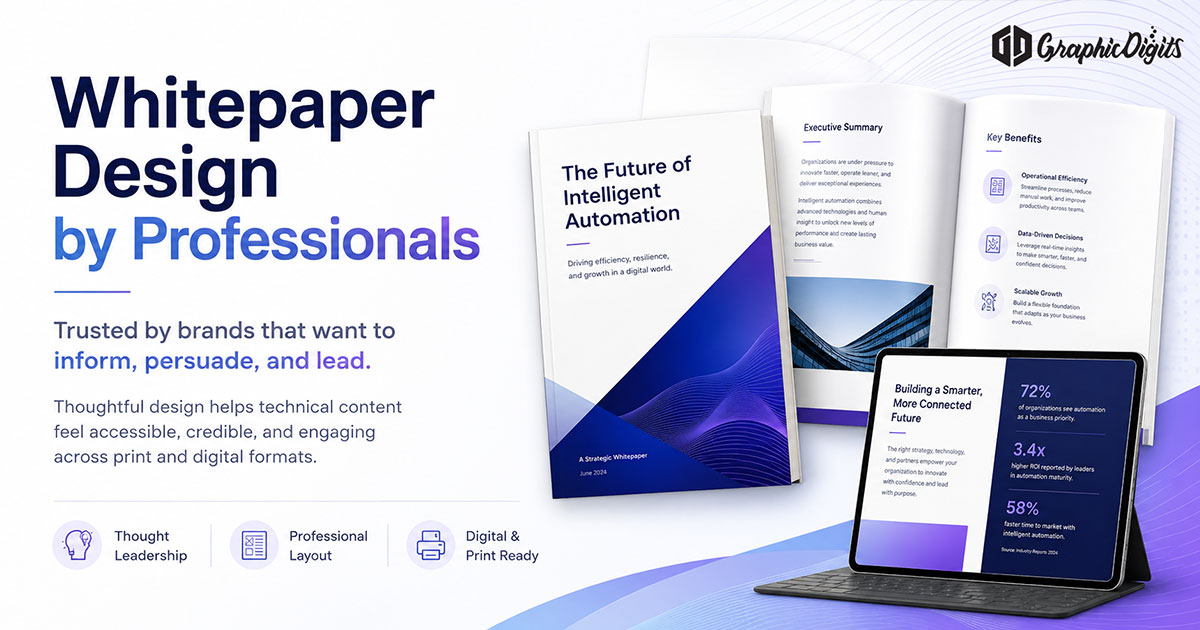
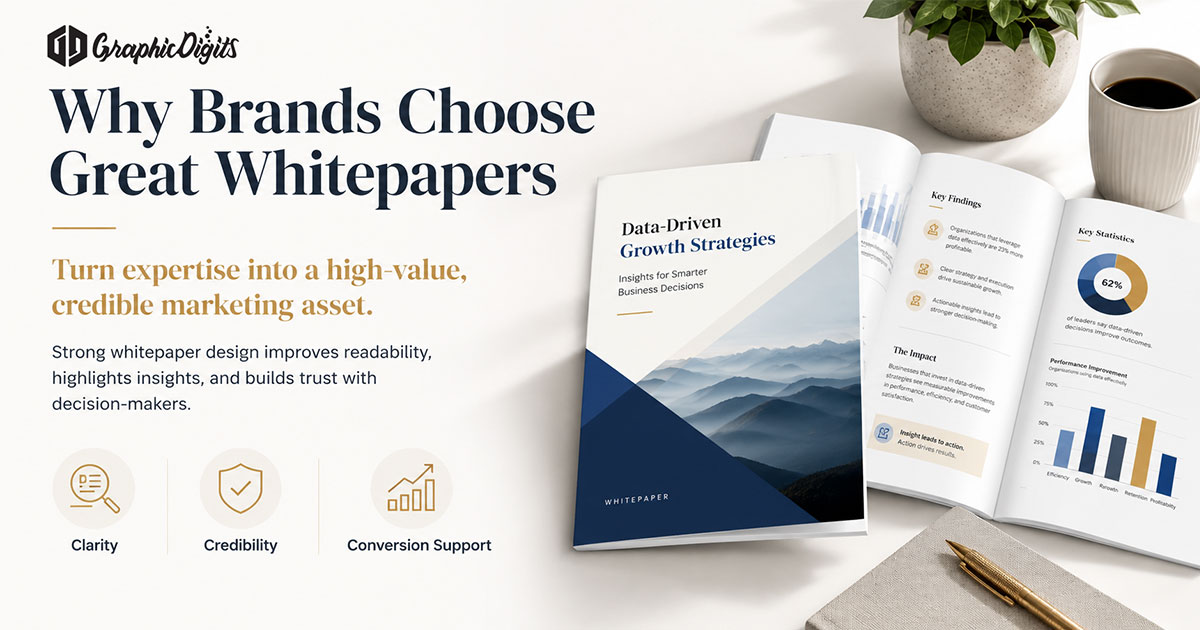
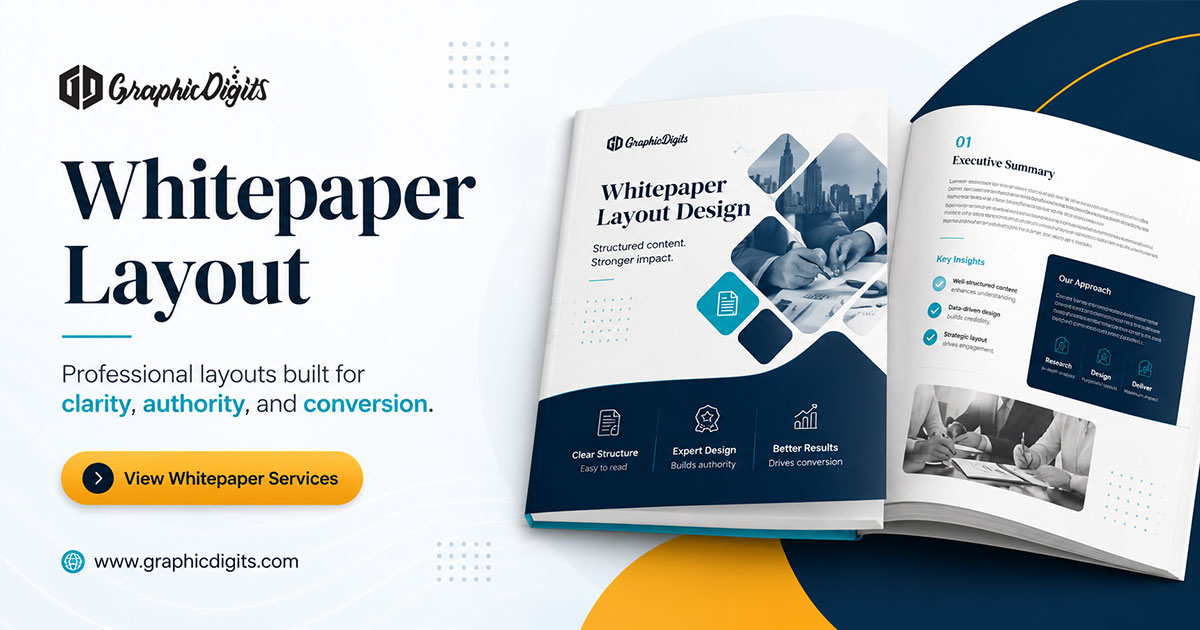
GraphicDigits provides whitepaper design services for branded, readable research documents. Bring approved or finalized content and research; we handle the visual communication—design systems, page hierarchy, charts and data visuals, and polished PDF presentation. This is design work, not research writing or authorship.
Whitepaper design is the set of decisions that turn research into something a busy reader can actually finish: what gets emphasis, what order ideas appear in, how evidence is shown, and how the document behaves on a laptop or phone screen. It is a reading strategy expressed visually, not decoration applied after the writing is done.
What GraphicDigits designs
Typical whitepaper design scope includes:
- Cover and interior page systems with clear hierarchy and typography
- Charts, data visuals, callouts, and branded page styling
- Reusable components for report series and polished digital PDF-ready delivery
Useful client inputs: approved content or research, chart data, brand assets, preferred size or format, and reference materials when available. We do not write the whitepaper, verify data, or provide legal or compliance review.
Design, layout, and related services
These three things get confused constantly, so it is worth separating them clearly:
- Whitepaper design (this service) — broader visual communication: hierarchy, narrative emphasis, typography, charts, branded styling, accessibility, and the finished design package.
- Whitepaper layout — page composition: grids, margins, spacing, cover structure, and print or digital page execution. Our companion guide to whitepaper layout covers those mechanics in detail.
- Related graphic design — broader production support through graphic design services when whitepapers sit alongside other branded assets.
If you need deeper page-composition guidance, use the layout guide. If you want GraphicDigits to design the document, the sections below explain the decisions and deliverables behind the work.
Start from the reader’s decision, not the page count
Before any visual choice, write down three things: who reads this, what decision they are weighing, and what they need to believe to move forward. A technical evaluator scanning for methodology needs different emphasis than an executive scanning for cost and risk.
Those answers set your design brief. They tell you whether the summary should lead with a number or a claim, whether the methodology belongs up front or in an appendix, and how much visual space the recommendation deserves.
Information hierarchy: decide what wins the page
Hierarchy is a ranking exercise before it is a typographic one. On every spread, one element should be clearly the most important, one or two should support it, and everything else should recede. When three things compete for the same weight, readers skim past all three.
A practical way to test this: look at a page for two seconds, then look away and say what you remember. If the answer is a decorative graphic rather than the finding, the hierarchy is inverted.
- Headings that carry meaning — write subheads that state the point, so the table of contents reads like a summary of the argument.
- One idea per opening — resist stacking a chart, a pull quote and a callout on the same page.
- Findings above detail — lead each section with the conclusion, then support it, rather than making readers assemble it themselves.
- Restraint as emphasis — emphasis only works when most of the page is calm.
Narrative design: sequence the argument visually
A whitepaper is an argument delivered over many pages, and design controls its pacing. Long stretches of uninterrupted text flatten momentum; a chart on every page creates noise without a through-line. Alternate modes deliberately so each section changes register.
A dependable sequence runs: state the problem in plain language, show the evidence, interpret it, then name the implication. Repeating that rhythm across sections lets readers drop in anywhere and still follow the logic, which is how most whitepapers are actually read.
Build a design system, not a set of one-off pages
Consistency is faster to produce and easier to read. Define a small system once, then apply it: a type scale with two or three sizes for body and headings, colour roles rather than a palette (one accent for emphasis, one neutral family for text, one muted set for chart series), and a fixed set of components such as callout box, statistic block, quote and figure caption.
Anchor that system to your existing brand so the document looks related to everything else you publish. If those foundations are unsettled, our branding design work covers type, colour and usage rules first. For how these choices land on the physical page, see the layout companion.
Charts and data that survive a skim
Data is where whitepapers earn credibility, and where design most often loses readers. The fix is rarely a fancier chart type. It is making the takeaway explicit and cutting everything that does not support it.
- Write the takeaway as the chart title — a sentence such as “Adoption doubled after onboarding changed” beats a label such as “Figure 3: adoption”.
- Pick the form that fits the comparison — bars for magnitude, lines for change over time, tables for exact values people will quote.
- Label directly — put labels on the series where possible instead of forcing a trip to a distant legend.
- State units and sources — sample size, timeframe and method belong near the figure, not only in an endnote.
- Use colour to mean something — highlight the series that carries the point and mute the rest.
When a finding deserves more than a chart, a standalone visual explainer can work harder than another page of prose. That is the territory of infographic design, and it is often the most reused asset from a whitepaper.
Accessibility is part of readability
Accessible design is not a compliance add-on; it is the same work that makes a document easier for everyone to read. Keep text and background contrast strong, and never let colour alone carry meaning in a chart. Add shape, position or direct labels as a second cue.
In digital PDFs, keep a logical reading order, tag headings properly so screen readers can navigate structure, write link text that describes its destination, and give every meaningful image alternative text that conveys the point rather than describing decoration. Body type should stay comfortable when a reader zooms on a phone.
Deliverables: what a finished whitepaper design includes
Design work is finished when someone else can extend it without guessing. That usually means more than a single exported file:
- A screen-optimised PDF with working internal links and bookmarks
- An editable source document so future edits do not require a rebuild
- A reusable template for the next report in the series
- Chart source files and the data behind them, so numbers can be updated
- A short usage note covering type sizes, colour roles and component rules
- Standalone exports of key figures for social posts, articles and slides
That last item matters more than it sounds. A whitepaper often becomes a talk or a deck, and designing the figures for reuse saves rework later — the same thinking behind our guide to design presentation.
Design mistakes that quietly cost readers
- Treating design as a final polish step instead of a structural decision
- Equal visual weight for every section, so nothing signals importance
- Charts that decorate the argument rather than prove it
- Stock imagery used as filler between blocks of text
- Sales language dropped into an educational document, which undercuts trust
- Design that cannot be repeated when the next report is due
Doing it in-house versus bringing in a design partner
A capable in-house team with a settled template can produce a good whitepaper. Outside help tends to pay off when the document represents your organisation publicly, when the data system is complex, when you need a repeatable template for a report series, or when the whitepaper has to sit alongside other long-form assets such as a company profile.
If you are weighing that, it helps to see finished work and understand how a project runs. Browse our design portfolio and read how we structure collaboration in our design process.
Conclusion
Good whitepaper design is not about making research look impressive. It is about making it easier to read: a clear hierarchy, a narrative that paces itself, data that states its own takeaway, accessible defaults, and deliverables that let the work continue. Decide those things early and the pages tend to fall into place.
Want a second set of eyes on a draft, or a template you can reuse for a report series? Request whitepaper design from Graphic Digits.
Frequently asked questions about whitepaper design services
What is included in whitepaper design services?
GraphicDigits whitepaper design services cover visual communication for the document: cover and interior page systems, hierarchy, typography, charts and data visuals, callouts, branded styling, accessibility-minded defaults, and polished digital PDF-ready delivery with editable sources when scoped.
Do you write the whitepaper content?
No. Clients provide approved or finalized research and copy. GraphicDigits handles design, layout presentation, hierarchy, and data visuals—not research writing, ghostwriting, data verification, or legal review.
Can you design charts and data visuals?
Yes. We design charts and figures that state a clear takeaway, use readable labels, and support the argument—plus standalone exports when key figures will be reused in slides or posts.
What files or content should a client provide?
Share approved content or research, source data for charts, brand assets (logo, colours, fonts), preferred page size or format, and any reference documents or previous reports you want the design to align with.
What is the difference between whitepaper design and whitepaper layout?
Whitepaper design is the broader visual communication system—hierarchy, narrative emphasis, typography, charts, and branded styling. Whitepaper layout is page composition: grids, margins, spacing, cover structure, and print or digital page execution. Our whitepaper layout guide covers those mechanics in detail.