To design infographics well, start with a sourced story—not a decorative template filled with invented stats. This article is a briefing guide. GraphicDigits designs static, brand-aligned artwork. When you are ready to hire, use infographic design.
An infographic is one visual argument. It is not a whitepaper and it is not a presentation deck. Pick the format that matches how people will actually read the piece.
When an infographic is the right format
Use one when a reader should grasp a single takeaway without a presenter:
- A process or timeline that is easier as steps than as paragraphs
- A comparison that would otherwise become a dense table
- A short set of sourced stats for a blog, LinkedIn post, or leave-behind
- A training explainer that must stay on-brand
Skip the infographic when the claim needs footnotes, caveats, or a live walkthrough. Those jobs belong in a document or slides.
What to gather before design starts
- The one sentence you want someone to remember
- Source data with dates and who owns the numbers
- Audience and channel (print sheet, blog, social crop, slide insert)
- Brand files: logo, colors, type
- Must-keep legal lines or disclaimers
If the data is still being decided, wait. Layout cannot fix a moving spreadsheet. We will not invent percentages to make a chart look full.
Types of infographics that usually work
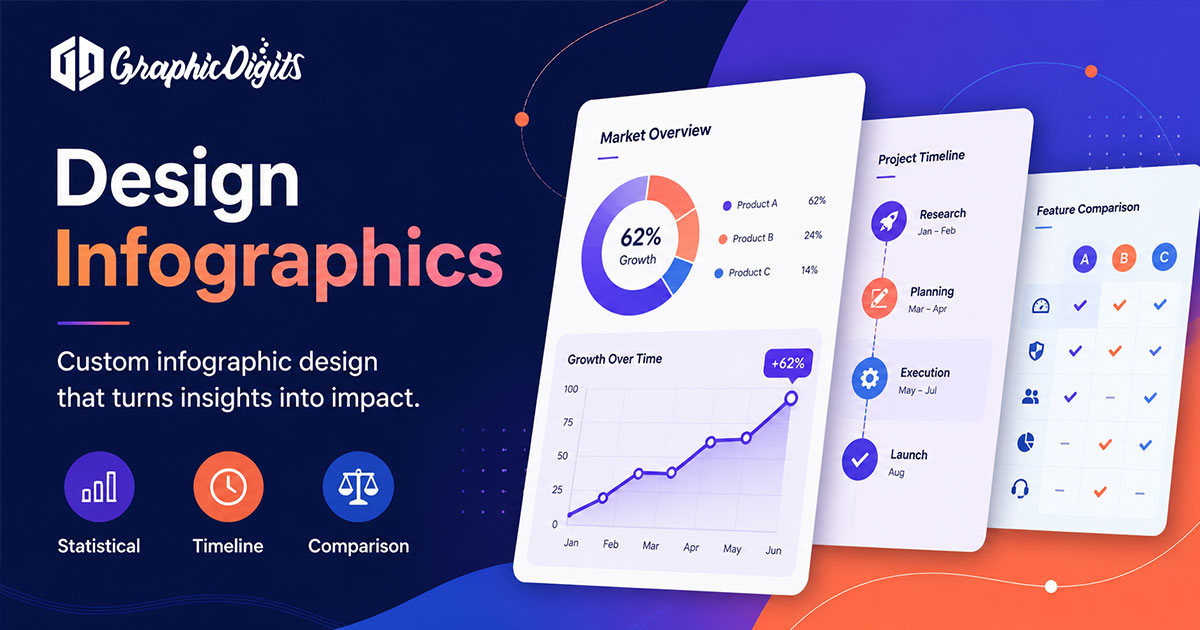
- Statistical — a few sourced figures with hierarchy, not a dashboard dump
- Process — numbered steps for how something works
- Timeline — milestones with dates you can defend
- Comparison — two or three options, same criteria on each side
- Educational — a concept map for training or patient/customer explainers
Social crops are a size variant of the same story, not a different strategy. Interactive or animated versions need a separate build—do not treat them as the default file.
How design should treat the data
Charts must match the numbers: axis labels, units, and time ranges stay visible. Icons should label categories, not decorate empty space. Color should follow the brand and help scanning—not a rainbow that hides the point.
DIY templates fail when they force your story into someone else’s sections. A custom layout starts from your takeaway and your source list.
Files you should expect
Typical delivery is a print-ready PDF plus web-ready raster or vector files sized for the channels in the brief. Source files can be included when the quote says so. GraphicDigits designs; we do not publish the post or run the ad account.
Revision rounds are scoped. Unlimited revisions usually means the data or the takeaway was never locked.
When you are ready to hire
Open the infographic design service page or request a quote with audience, takeaway, sources, and sizes. This guide stays the planning page; production lives on the service URL.
Frequently asked questions about designing infographics
What does it mean to design infographics?
It means turning a sourced set of facts into a single visual: hierarchy, icons, charts, and short labels that a reader can scan. GraphicDigits designs the artwork. We do not invent statistics or run your research.
How is this guide different from infographic design services?
This article is a briefing guide: when an infographic is the right format and what to send. The infographic design service page is where you hire for production files.
When should I use a whitepaper or slides instead?
Use a whitepaper when the argument needs pages of proof. Use a presentation when someone will talk through the story live. Use an infographic when one screen or one printed sheet should carry the whole point.
Do you build interactive infographics?
Default delivery is static print-ready and web-ready artwork. Clickable or animated pieces need a separate development scope. Do not assume interactivity is included.
Who is responsible for the data?
You are. Send sources, dates, and any claims that legal or product must approve. We will flag gaps in the brief; we will not fabricate numbers to fill a layout.
How do we start an infographic project?
Share the audience, the one takeaway, source data, brand files, and where it will live (blog, LinkedIn, print, slide insert). Request a quote or open the infographic design service page. Revision rounds are scoped—not unlimited.